New Data Points To Continuing Warming Pause
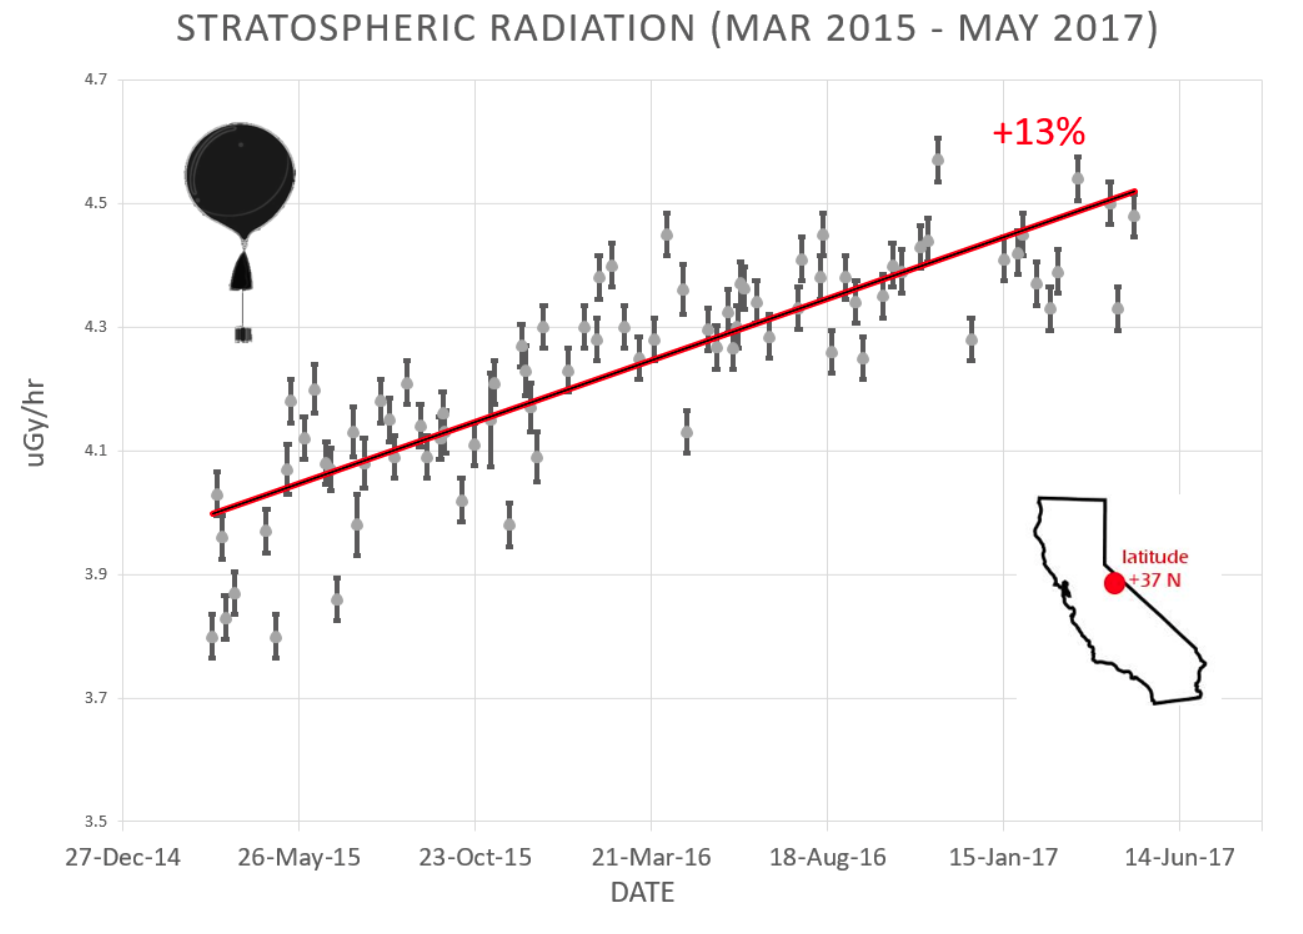
Cosmic ray intensities from March 2015 to May 2017.
Image and Data from Spaceweather.com
Today marks the sixth straight day for which there were absolutely no sunspots on the Sun. So far this year, out of the 135 days that have passed by, 36 days have been without sunspots, 26.7% of the total. Last year, a total of 32 days, or 8.8% were without sunspots. What all this portends is that we are descending into a particularly low solar minimum of the 11 year sunspot cycle, which should arrive sometime in 2019-2020. In turn, what this implies is our current pause in global warming will probably continue — worse luck for the Anthropogenic Global Warming (AGW) enthusiasts!
The Meaning of the Data
Sunspots are correlated with the activity of the Sun, particularly with how much power the Sun is radiating and the intensity of the solar wind it is producing. They are a part of cooling mechanisms that help the Sun release thermal energy through the solar wind when it starts to overheat. Monthly averaged sunspot numbers for recent decades, plotted by Dr. David Hathaway of NASA, are shown below.

NASA / ARC / Dr. David Hathaway
Besides the periodicity of the 11 year sunspot cycle, there are two important takeaways from this graph. First is the increasing peak values at solar maxima from about 1970 to 1990 (cycles 20 to 22); second is the decreasing peak values from about 1990 to around 2014 (cycles 22 to 24). The first period is correlated with the period of global warming from around 1975 to the late 1990s, and second with out current “pause” of global warming starting sometime around 2000. This is demonstrated by the record of globally averaged temperature anomalies shown below.

Image Credit: National Climatic Data Center (Now the National Oceanic and Atmospheric Administration)
Note the global warming between 1975 and the late 1990s stands out, as well as our current pause in warming. Note also the pause in warming between roughly 1940 and 1975, which is also consistent with the peaks in sunspot number for 1960 and 1970.
There is a by now well-known mechanism for explaining this correlation between solar activity, as indicated by sunspot numbers, and periods of global warming and cooling. Discovered by Dr. Henrik Svensmark and Dr. Eigil Friis-Christensen of the Danish National Space Institute (DTU Space), this mechanism links the shading of the Earth from solar irradiation by cumulus clouds with the amount of cosmic radiation from outside our solar system penetrating our atmosphere. The intensity of cosmic rays penetrating the atmosphere are in turn modulated by the intensity of the solar wind, as indicated by the sunspot number. To read more about this mechanism, see my post Solar Wind, Cosmic Rays and Clouds: The Determinants of Global Warming. Alternatively, you can watch the truly excellent video embedded below. It is a beautiful, intriguing production that presents the development of Henrik Svensmark’s ideas, and his collaboration with Dr. Nir Shaviv of the Racah Institute of Physics at the Hebrew University of Jerusalem.
If this view of reality is correct, the decreasing sunspot numbers (more particularly, the currently decreasing peaks in the 11 year sunspot cycle) show that the sun’s solar wind is on average becoming less intense. This means the intensity of cosmic rays penetrating our atmosphere should be becoming more intense. The new data motivating this essay, displayed in the plot at the top of this post, shows that this is precisely the case. Not only that, but it shows the increase in cosmic ray intensity in the stratosphere is itself quickening.
The stratospheric weather balloon measurements of cosmic ray intensity were produced by a student group called Earth to Sky Calculus, affiliated with the website Spaceweather.com. I am currently displaying two previous plots of their cosmic ray intensity time series on my Solar Activity page. In a plot from January 1, 2015 to February 5, 2016, a linear fit to the data showed a +12% increase in cosmic ray intensity. A plot from February 15, 2015 to June 29, 2016 showed a +12.5% increase. The new data at the top of this post from December 27, 2014 to the present shows a +13% increase. The trend is accelerating!
The fact that this increase in cosmic ray intensity is occurring during a pause in warming demonstrates the Svensmark model is consistent with observed data. You might well ask why we are only seeing a pause in warming. Why should we not see actual cooling? The reason is that this cooling mechanism is merely modulating another, much longer period warming-cooling mechanism, which also has nothing to do with mankind’s CO2 emissions. This natural warming-cooling oscillation is called the Dansgaard-Oeschger cycles, in which each warming and cooling phase lasts a minimum of 500 years. Also, read here concerning these poorly understood cycles. The last cooling phase was the Little Ice Age, which ended around 1850. We are now about 170 years into the warming phase which should end sometime between 2300 and 2400, with a total temperature increase of approximately 4°C. Now each warming and cooling phase of the Svensmark mechanism lasts about 30 years. During this warming phase of the Dansgaard-Oeschger cycle, when the Svensmark mechanism is also warming, it enhances the warming; when the Svensmark mechanism is cooling, it mostly cancels out the warming of the Dansgaard-Oeschger cycle, causing the observed pause in warming.
Unlike the AGW theory, this picture of reality hangs together and is self-consistent with everything we observe.
Views: 1,961


