Are Hurricanes Becoming Worse Because of Global Warming?
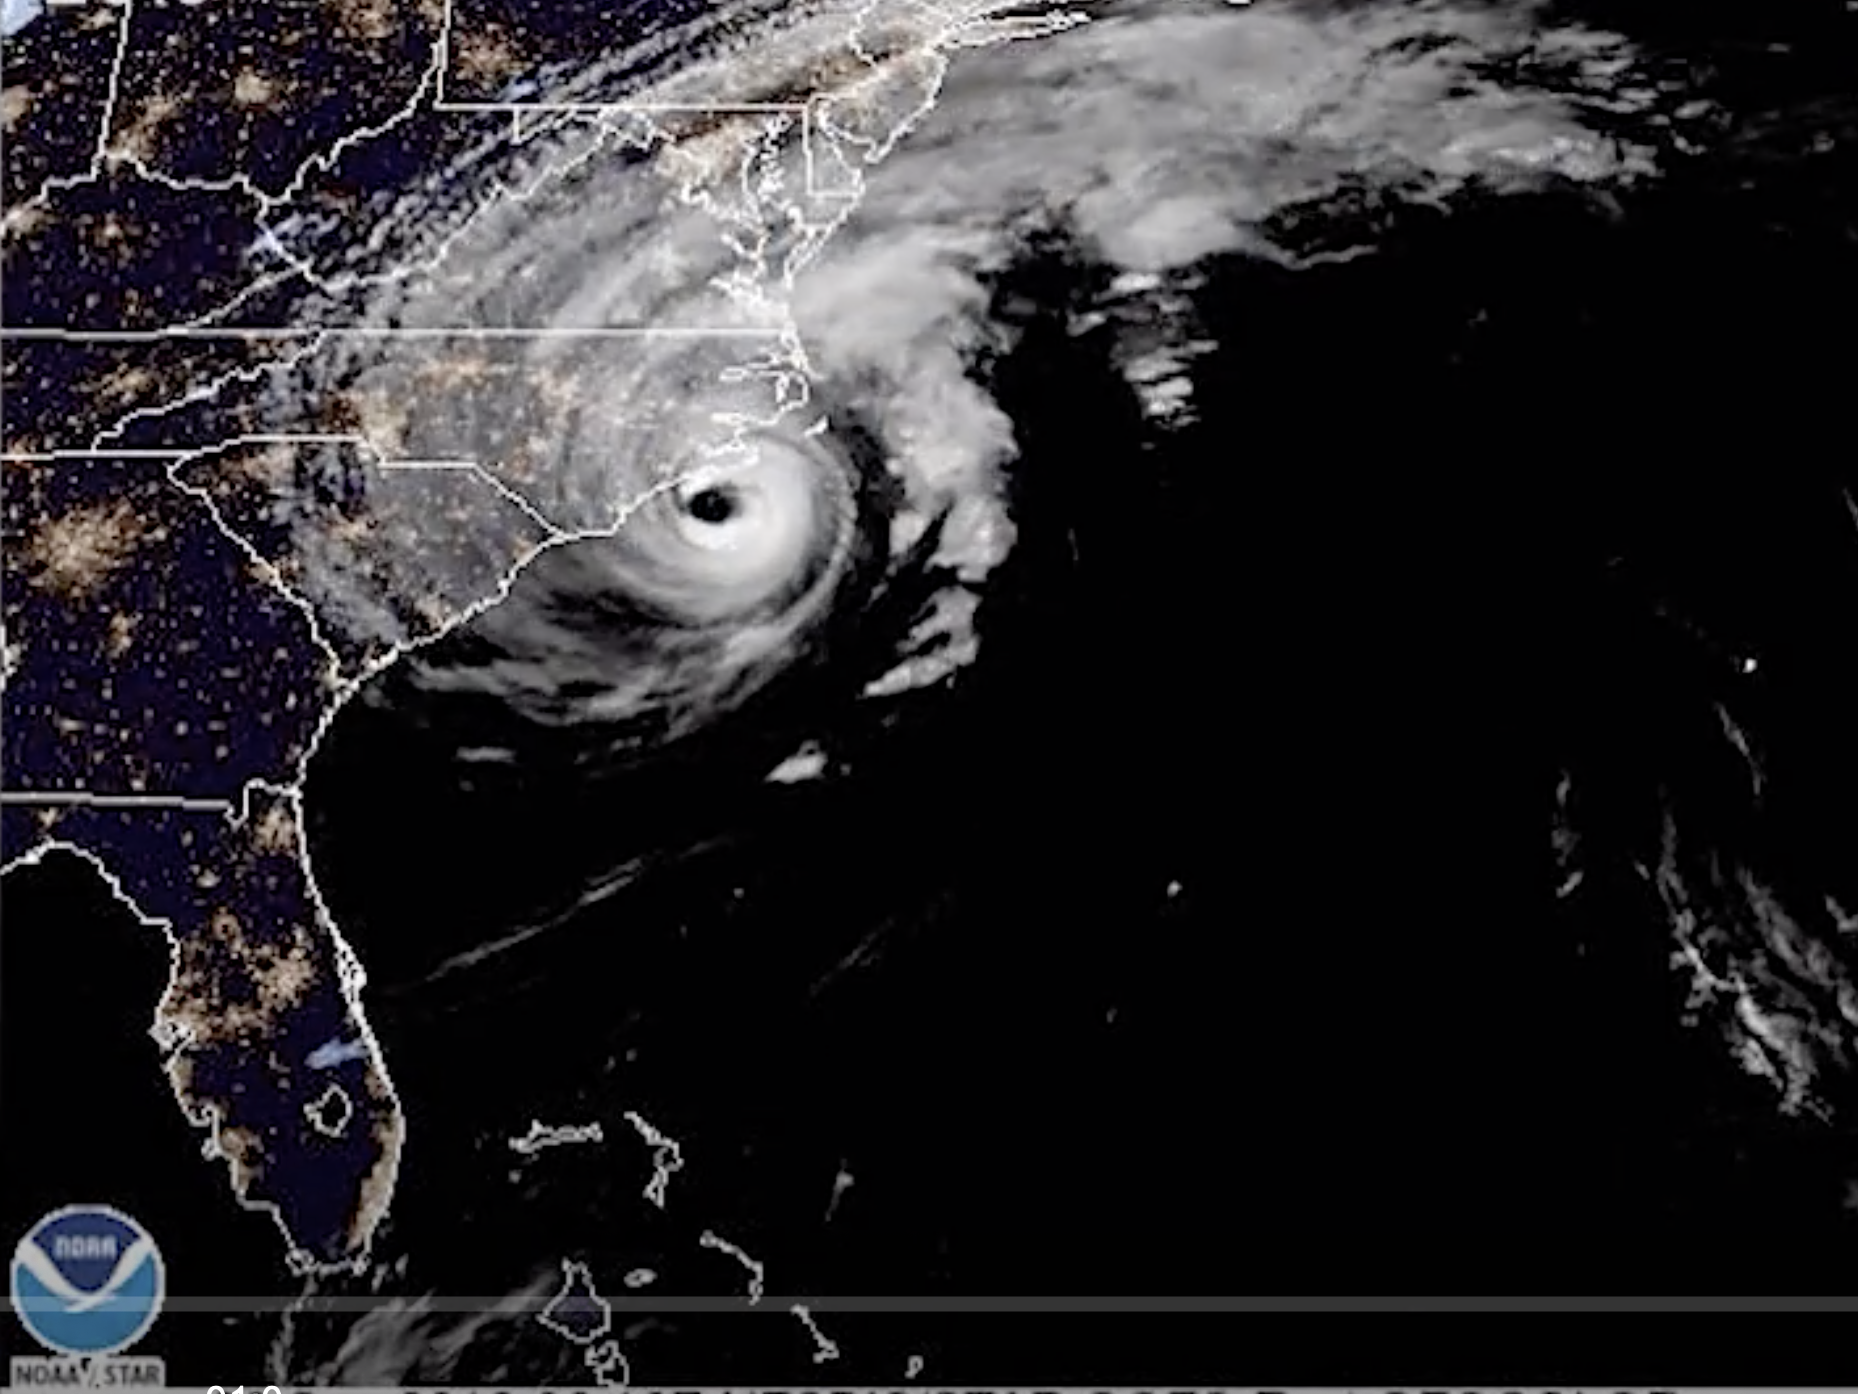
With the recent appearance of hurricane Dorian, progressives’ periodic accusations that humankind is making such storms increasingly severe have arisen yet again. Should they be believed?
The Accusations
In their zeal to gain control over energy production, progressives in the U.S. and other dirigistes overseas never miss a chance to push the narrative that humans are making the climate worse through global warming. Their story is humans are increasing atmospheric temperatures by emitting the greenhouse gas carbon dioxide.
One of the effects, they assert, is atmospheric thermal energy residing in CO2 passes into and is stored in the oceans’ surface. The warm surface waters then act as a source of free energy upon which a hurricane feeds, making the storm stronger. If humans provide additional free energy by increasing atmospheric CO2, we are to blame for growing numbers of hurricanes and their increasing severity. A better-than-average article advocating this point of view is the Guardian Post’s Is climate change making hurricanes worse? by Daniel Levitt and Niko Kommenda
There are several ways to debunk this tale of human responsibility for warming ocean waters. Some of these routes pass through the laws of physics and applicable physical facts. I will describe some of these later.
However, a great deal of debunking is achievable by looking at empirical historical data. In the Levitt and Kommenda article cited above, its major weakness resides in the low numbers in the annual statistics and in the high level of noise in the data. Let us take a look at the historical data.
What Measured Data Tells Us
The data we will examine here were taken from the Hurricane Research Division of the Atlantic Oceanic & Meteorological Laboratory of NOAA. The number of named storms is the number of tropical storms plus all hurricanes for a particular year. The number of major hurricanes is the number that are category 3 or higher on the Saffir-Simpson hurricane scale. The index ACE, or Accumulated Cyclone Energy, measures the intensity of individual named storms (tropical storms and hurricanes). Strictly speaking, the index is not really energy since it is calculated only from the squares of wind speeds. Every six hours, the maximum sustained wind speeds are estimated and their squares summed over each six-hour period the storm remains a named storm. The sum is multiplied by 10-4. The speeds are in knots (nautical miles per hour), and therefore a storm’s ACE is in units of knots-squared.
ACE is also summed over all named storms for a year to give the year’s ACE. This is the ACE tabulated by the Hurricane Research Division of NOAA.
All these numbers are tabulated (guesstimated?) back to 1851. However, it is highly likely many of the storms in the very early years that did not make landfall were missed altogether. Therefore we will look only at the data since 1950 when the means for discovering and measuring these storms were much better.
First, let us look at the number of named storms, all hurricanes, and major hurricanes from 1950 through 2018.

Hurricane Research Division, Atlantic Oceanic & Meteorological Laboratory of NOAA.
You can see how noisy the data is. Also, the annual numbers of all hurricanes and major hurricanes show no obvious trend. There is some indication the annual number of all named storms, including tropical storms, has increased since the year 2000.
What about the intensities of all these storms over time? The plot of the ACE index over this period is shown below.

Hurricane Research Division, Atlantic Oceanic & Meteorological Laboratory of NOAA
Again, the high level of noise in the plot is evident, and there is no obvious discernible trend.
One way of extracting a signal from noise is to average the data over fixed time periods. In the two plots below, the data were averaged over ten year periods. For example, the data for the 1950s was averaged from 1950 to 1959. The point for the 2010s was averaged from 2010 to 2018.

Hurricane Research Division, Atlantic Oceanic & Meteorological Laboratory of NOAA
As speculated there has been an increase in the number of named storms (including tropical storms) in the 2000s and the 2010s. However, the total number of hurricanes and major hurricanes is substantially the same as for the 1950s. Actually, there is a slight decrease in the average number of major hurricanes from 3.9 in the 1950s to 3.0 in the 2010s. The average number of all hurricanes in the 2010’s (7.3) is very close to that in the 1950s (6.9).
What about the averaged storm intensities, i.e. ACE?

Hurricane Research Division Atlantic Oceanic & Meteorological Laboratory of NOAA
The ten-year average of storm intensity is again less in the 2010s (120.6) than in the 1950s (121.9).
The hypothesis global warming is causing increasing numbers and intensities of major storms is very plausible. But the statistical evidence for it is weak to non-existent.
So Is There Global Warming?
So, what does all this imply? Does it mean there is no global warming? Not at all! Pretty much everyone agrees there is some degree of global warming over the past century. To demonstrate this fact, I republish here an old plot of the globally averaged temperature anomalies produced by NOAA.

Image Credit: National Climatic Data Center
The nature of this data set is discussed more thoroughly in the post Global Warming Data. The nature of the global warming “pauses” in the period 1941-1975 and in the period since the late 1990s is discussed in the posts Clouds and Global Warming and Solar Wind, Cosmic Rays and Clouds: The Determinants of Global Warming.
However, what the data about named storms does demonstrate is this: The oceans are not being warmed enough to provide enough free-energy to significantly increase the numbers of hurricanes nor to increase their intensities when averaged over ten year periods. When this conclusion is added to other physical facts, the result is devastating for the hypothesis of man-caused global warming.
The overall conclusion from this fact and a few others is that it is physically impossible for atmospheric CO2 to be the cause of the observed global warming. The other pertinent facts are the following.
1. Atmospheric carbon dioxide is a trace gas. Its current concentration is about 400 parts per million by volume, which makes the fraction of the atmosphere that is CO2 at 0.0004.
2. Each CO2 molecule has only three energy transitions that can absorb infrared photons. This is shown in the plot below. Once all three energy transitions have been filled, a CO2 molecule can absorb no more IR photons until one of the excited states has decayed to its ground state.

Image Credit: Global Warming
3. The amount of thermal energy absorbed by CO2 increases only logarithmically with increasing CO2 concentrations. This is because it can absorb only from within its absorption bands, which are narrow. As more CO2 is added by man, those molecules cannot absorb much more, because there are not enough remaining photons at the right wavelengths. The following graph demonstrates this.

Image Credit: JoNova.com
4. The time-of-flight of an infrared photon from the surface of the Earth to the top of the troposphere is on the order of 10-5 seconds. This is much shorter than the half-life of most of the CO2 excited states, which can be up to half a second. The time of flight between molecules is even shorter, ensuring most CO2 molecules are in a saturated state.
5. Energy transfer between atmospheric CO2 and ocean water is insufficient to cause increased water evaporation. Taking into account the differences in thermal heat capacity and in total masses between ocean water and atmospheric CO2, basic thermodynamics shows how we can calculate the change in water temperature with a decrease of CO2 temperature by one degree Kelvin. The answer is 4×10⁻⁷ ºK. It actually would not increase by even that amount, because other physical mechanisms would not allow a complete realization of thermal equilibrium.
The last point in the list is particularly important. For a long time, proponents of Anthropogenic Global Warming (AGW) have known that points 1 through 4 in the list made it impossible for CO2 to be responsible for global warming all by itself. Therefore, to hang global warming on man-emitted CO2 would require some sort of positive feedback mechanism. Somehow the heat absorbed by CO2 would have to be funneled into something else that absorbed heat much more. The answer they came up with was ocean water. Water has a greater heat capacity than CO2, and there is a lot more of it. If enough additional heat provided by CO2 absorption could evaporate ocean water into the atmosphere, one might be able to show small amounts of increased CO2 causing much larger increases in atmospheric water vapor. This might cause a runaway heating effect. Item 5 in the list shows this to be impossible.
The fact major storms are not increasing in intensity averaged over decades is another demonstration of the nonexistence of this feedback mechanism. Increasing atmospheric CO2 is not substantially changing the water temperatures enough to fuel more, and more intense hurricanes. Atmospheric CO2 concentrations have been rising essentially linearly with time, as shown in the graph below.

Yet, time-averaged storm intensities have not been increasing linearly with time. In fact, the time averaged ACE is currently declining. The feedback mechanism craved by AGW proponents is nonexistent.
Views: 3,812


