Growing U.S. Economy Continues to Sizzle!
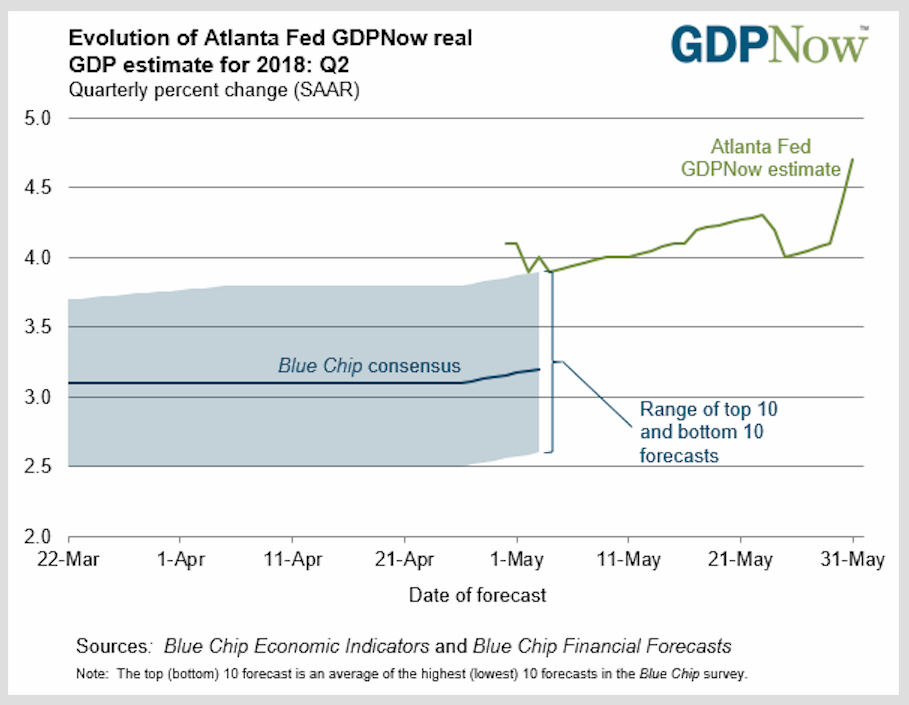
Time evolution of the Atlanta Federal Reserve’s GDPNow estimate for Q2 GDP growth, as of May 31, 2018.
Federal Reserve Bank of Atlanta / GDPNow
The plot above emphasizes again just how much our growing U.S. economy is sizzling. The Atlanta Fed’s GDPNow statistic is the best estimate the Fed has of how much GDP will grow in the present quarter. The current estimate is 4.7%! This number is so large, it is hard to believe GDP growth will actually end up that high. Nevertheless, if the final number ends up anywhere close to 3.0% or higher, the result would be a ringing vindication of free-market economic policies over the more dirigiste policies of Barack Obama and the progressive Democrats.
Today’s May Unemployment Report
Even more emphasis is given to this glowing message by this morning’s unemployment report for May. The consensus expectation had been for 188 thousand new jobs and a U3 unemployment rate of 3.9%. The actual report from the Bureau of Labor Statistics showed nonfarm payroll employment increased by 223 thousand new jobs in May. The headline U3 unemployment rate decreased to 3.8%. Below is the plot the BLS provided to show the time evolution of the unemployment rate from May 2016 to May 2018.

U.S. Department of Labor / Bureau of Labor Statistics
Clearly, the unemployment rate has been declining consistently during the Trump administration. According to the Federal Reserve Economic Database (FRED), this is the lowest U3 rate since April 2000. You would have to go all the way back to October 1969 to find lower unemployment!
Why Are We Growing?
So why is the growing U.S. economy sizzling so hot? Just as important, why was it stagnating in recent decades? From the Great Depression of the 1930s to the present time, electorates of Western countries accepted the proposition that governments were required to manage their economies. Decade after decade these governments relentlessly accumulated power to regulate and control their economies.
I have discussed elsewhere how any modern economy is a chaotic system. In fact, it is chaotic in a specific mathematical sense. A perturbation in a mathematically chaotic system can grow rapidly in generally unpredictable ways. If a government diverts economic resources to encourage ends it desires, it will deprive those same resources from other economic production people might desire more. For example economic assets directed to the production of solar and wind energy is not available for producing more conventional power plants. More damaging is economic regulation that produces unpredictable, usually unintended, and almost always undesirable side effects. One example of that was the monetary policies of the Federal Reserve in the late 1920s and early ’30s, which caused the Great Depression. Another was the housing policy of the Clinton administration, which was the fundamental source of the Great Recession of 2008-2009. Yet another example was progressives’ erroneous reaction to the Great Recession. Believing the Great Recession was caused by the greed of bankers and investors, progressives passed the Dodd-Frank Act. This misbegotten law put banks and institutional investors in a straitjacket that stifled investment and put small community banks on the endangered list. Its recent partial repeal will help our growing economy to sizzle even more.
It is not hard to see why an economy is a chaotic system. Just like a physical fluid system such as the atmosphere, any economy is made up of a very large number of components. These are called economic agents: consumers, producers, merchants, and investors. Just as molecules in the atmosphere interact predominantly locally through collisions, economic agents tend to interact in pairs through trades. By their economic decisions, investors, producers, buyers and sellers of goods can then influence the economic behavior of others as the news and effects of their decisions propagate. The ways in which they propagate are often unpredictable. The larger the number of interacting components (economic agents) the economy has, the more chaotic it becomes.
When a government increases economic regulation, it reduces the degrees of freedom available to the system’s economic agents. In a physical fluid system, when degrees of freedom are removed through physical constraints, thermal energy is removed from the molecules. The formerly fluid system then freezes into an unchanging solid state body. This is the same result achieved by governments that pile on one economic regulation after another. Just consider the erstwhile Soviet Union, or present-day Cuba and Venezuela if you need to be persuaded.
With the exception of the Republic of Ireland, this is the course most Western governments, including the United States, have followed for decades. What Donald Trump’s administration has done over the past one-and-a-half years is to reverse this course. He and the Republican Party have changed course in two ways: First, he has started a major deconstruction of the federal regulatory state, helping to “unfreeze” American businesses; second, taxes on both businesses and the middle class have been greatly reduced. The combination of the two kinds of action have allowed companies to be profitable again by increasing production. That businesses are indeed increasing domestic investments can be seen in the time plots of manufacturers’ new orders for non-defense capital goods and new orders for durable goods shown below.

St. Louis Federal Reserve District Bank / FRED

St. Louis Federal Reserve District Bank / FRED
These and other encouraging economic indicators can be found in the post U.S. Economy and Stock Markets, March 2018.
This rapidly growing U.S. economy provides accumulating empirical evidence for the superiority of free-markets over the dirigiste economic policies of the Democrats.
Views: 1,791


